Usage events
The most important parts of your app’s story unfold after installation. Usage events capture this narrative by tracking every meaningful interaction customers have with your app - from their first feature discovery to their thousandth successful operation. While basic analytics tell you who installed, usage events show you exactly how customers are finding value and where they might need help.
Think of it as upgrading your entire understanding of your app’s performance. When you know precisely how customers interact with features, every decision becomes clearer - from product development to customer success strategies.
Why behavioral data matters
Understanding real customer behavior transforms how you run your app business. Usage events turn abstract concepts like “customer success” into concrete data points that guide smart decisions. Here’s how this plays out across your organization:
Guide product development with real data Without behavioral data, product decisions often rely more on instinct than evidence. Usage events change this by showing you:
- Which features actually drive retention - spot the tools your successful customers can’t live without
- Where users consistently get stuck - identify and fix friction points before they impact growth
- Error patterns that deserve attention - prioritize fixes based on their real impact on customers
- How UI changes perform - measure improvements with actual usage data instead of guessing
- Which features resonate with different customer segments - build for your real audience
Transform customer success from reactive to proactive Instead of waiting for support tickets, usage patterns help you spot opportunities and risks early:
- Catch adoption issues while there’s still time to help
- Build better onboarding by learning from your most successful customers
- Identify power users who could become valuable advocates
- Track feature discovery to ensure customers find your best tools
- Monitor usage health to prevent churn before it happens
Make better business decisions Replace hunches with data-driven decisions that drive growth:
- Design pricing tiers based on how customers actually use your app
- Spot opportunities for premium features by watching usage patterns
- Understand which customer segments get the most value from your app
- Track usage-based billing accurately and fairly
- Measure the real return on your development investments
Getting started with events
Understanding how customers use your app requires capturing both what they do in your interface and what happens behind the scenes. Mantle makes this comprehensive tracking possible through two complementary approaches, each revealing different aspects of customer behavior and value delivery.
Frontend events: The quick start
Your app’s interface is where customers first discover value. Frontend tracking through our lightweight pixel reveals not just what features customers find, but how they navigate your app’s capabilities:
Navigation patterns Understanding how customers move through your app helps you optimize their journey to value:
- Page view sequences show natural user flows - spot where customers go after key actions
- Time-on-page metrics reveal feature engagement - identify which tools hold attention
- Entry and exit points map discovery patterns - optimize critical first impressions
- Search and filter usage exposes user intent - understand what customers really want
- Menu interaction patterns show feature findability - improve your information architecture
Interface engagement Beyond basic navigation, seeing how customers interact with specific features guides product decisions:
- Button clicks reveal feature discovery - track which capabilities attract attention
- Form interactions highlight completion barriers - identify where customers need help
- Modal and popup engagement shows content effectiveness - optimize your messaging
- Error encounters pinpoint frustration points - fix issues before they impact retention
- Configuration changes track customization patterns - understand how customers adapt your app
Learn more about how to add the Mantle pixel
Backend events: The complete picture
While frontend events show merchant interactions with your interface, backend events tell the story of what’s actually happening in your app - both when merchants actively use features and when your app is quietly working in the background. These server-side metrics help you understand if things are working, what’s being accomplished, and how much value is being delivered.
Core feature usage Your app creates data in two key ways:
- When merchants do things in your app - like setting up rules or adjusting settings
- When your app does its job - like running those rules or getting views on the storefront. Tracking both helps you understand not just if features are being used, but how well they’re performing and what impact they’re having.
Making sense of results Beyond just tracking events, you’ll want to understand:
- How often things are happening
- Which features are delivering the most value
- Where automated processes are succeeding
- When manual operations might need adjustment
- How changes and optimizations impact outcomes
Get started with our API documentation
Understanding your events
The data you collect becomes truly valuable when you can spot patterns and act on them. Mantle’s Usage Events report transforms raw event data into clear, actionable insights:
The visualization
The main chart tells your usage story through intuitive visuals:
- A purple filled area shows current period events
- A dotted trend line compares to your previous period
- Clear period-over-period change indicators
- Total event volume for quick health checks
- Customizable date ranges for flexible analysis
Analysis tools
Turn raw event data into actionable insights with powerful analysis options:
Event analysis methods Each analysis method reveals different aspects of customer behavior:
- Count occurrences to understand feature popularity and overall engagement
- Measure unique customers to separate power users from occasional visitors
- Sum values to track revenue impact or resource consumption
- Filter by action type to focus on specific user workflows
- Combine methods to build rich pictures of customer behavior
Customer segmentation Move beyond aggregate data to understand specific customer groups:
- Individual customer lookups provide crucial context for support interactions
- Segment analysis reveals how different customer types engage with your app
- Comparative analysis helps identify what makes some customers more successful
- Track adoption patterns across different customer types
- Identify the behaviors that indicate customer success
Visualization options
Choose the view that best tells your story:
- Line charts track trends over time
- Column views compare discrete periods
- Stacked visualizations show composition
- Save views for regular monitoring
Taking action on insights
Usage events become truly valuable when they drive decisions. Here’s how different teams can leverage this data:
Product development
Let real usage patterns guide your roadmap:
- Track feature adoption to guide future investment
- Study user workflows to improve experiences
- Prioritize fixes based on customer impact
- Optimize performance based on actual usage
- Validate changes with concrete metrics
Customer success
Transform data into proactive support:
- Improve onboarding with proven paths
- Spot churn risks through usage changes
- Guide targeted outreach efforts
- Enable data-driven support
- Power personalized communication
Business strategy
Build your business on evidence:
- Design pricing tiers around usage patterns
- Guide feature investment decisions
- Identify market opportunities
- Shape partnership strategies
- Plan infrastructure needs
Beyond basic tracking
Getting events flowing is just the beginning. Once you’re tracking behavior, you unlock powerful capabilities across Mantle:
Usage metrics
Transform raw events into meaningful KPIs that power your entire platform:
- Track success at both customer and app levels
- Enable usage-based billing with accurate data
- Drive automated workflows based on behavior
- Power targeted customer communications
- Guide business decisions with real metrics
Workflow automation
Put your usage data to work:
- Trigger actions based on customer behavior
- Automate timely communications
- Flag accounts needing attention
- Update customer attributes automatically
- Sync data across your stack
Advanced analytics
Dig deeper into customer behavior:
- Build sophisticated funnel analysis
- Create behavioral cohorts
- Track adoption over time
- Measure feature impact
- Analyze customer journeys
Ready to understand what your customers are really doing? Start with our integration guides to get events flowing, then explore Usage Metrics to transform those events into actionable insights across your business.
Need help figuring out what to track? Our team is here to help you capture the right data to drive growth.
Frequently asked questions
Why don't my usage event counts match my billing data?
Use the "Use charge billing date instead of event timestamp" option for accurate comparisons. Usage events can reach Mantle hours or days after they occur, so comparing raw event timestamps to charge dates creates timing mismatches that make your numbers look off.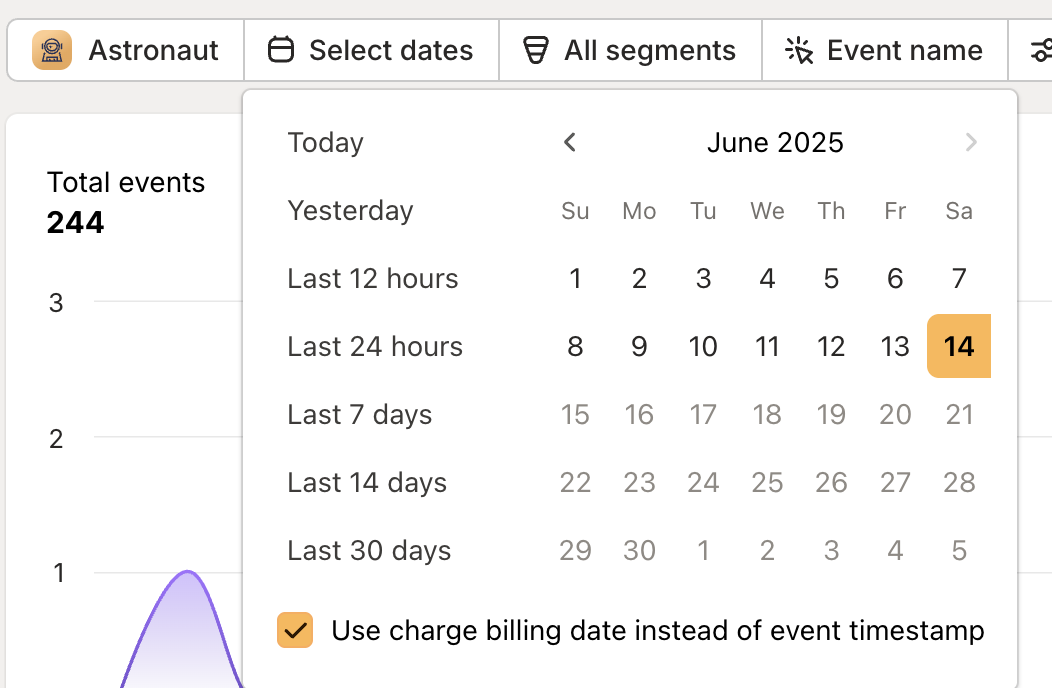
This option ensures you're comparing usage events with what was actually billed on the correct dates.
How do billing status groupings work?
When you group by billing status, events are categorized as:
• No charge: Events not tied to billing
• Pending: Events awaiting billing processing
• Billed: Events that have been invoiced
This helps you understand the relationship between usage and revenue.
Can I segment usage events by customer characteristics?
Yes! Use customer segments to analyze usage patterns by:
• Shopify plan (Basic, Plus, etc.)
• Geographic location
• Custom customer attributes
• Subscription status or plan type
This helps you understand how different customer types engage with your features.