Customer insights
Customer Insights gives you a powerful birds-eye view of your entire customer base. By analyzing performance metrics and trends, you can make data-driven decisions that directly impact your revenue, retention, and growth.
While Segments & Filters help you find specific customer groups, Customer Insights helps you measure and understand them - revealing patterns you might otherwise miss.
From the Customer Insights screen, you can immediately:
- Track key metrics: See your CLV, AMR, and TTU data with multiple calculation methods
- Apply powerful filters: Narrow your analysis to specific customer segments
- Pivot your data: Break down results by app plan, traffic source, or dozens of other dimensions
- Export results: Share your findings or analyze further in your preferred tools
Understanding customer insights
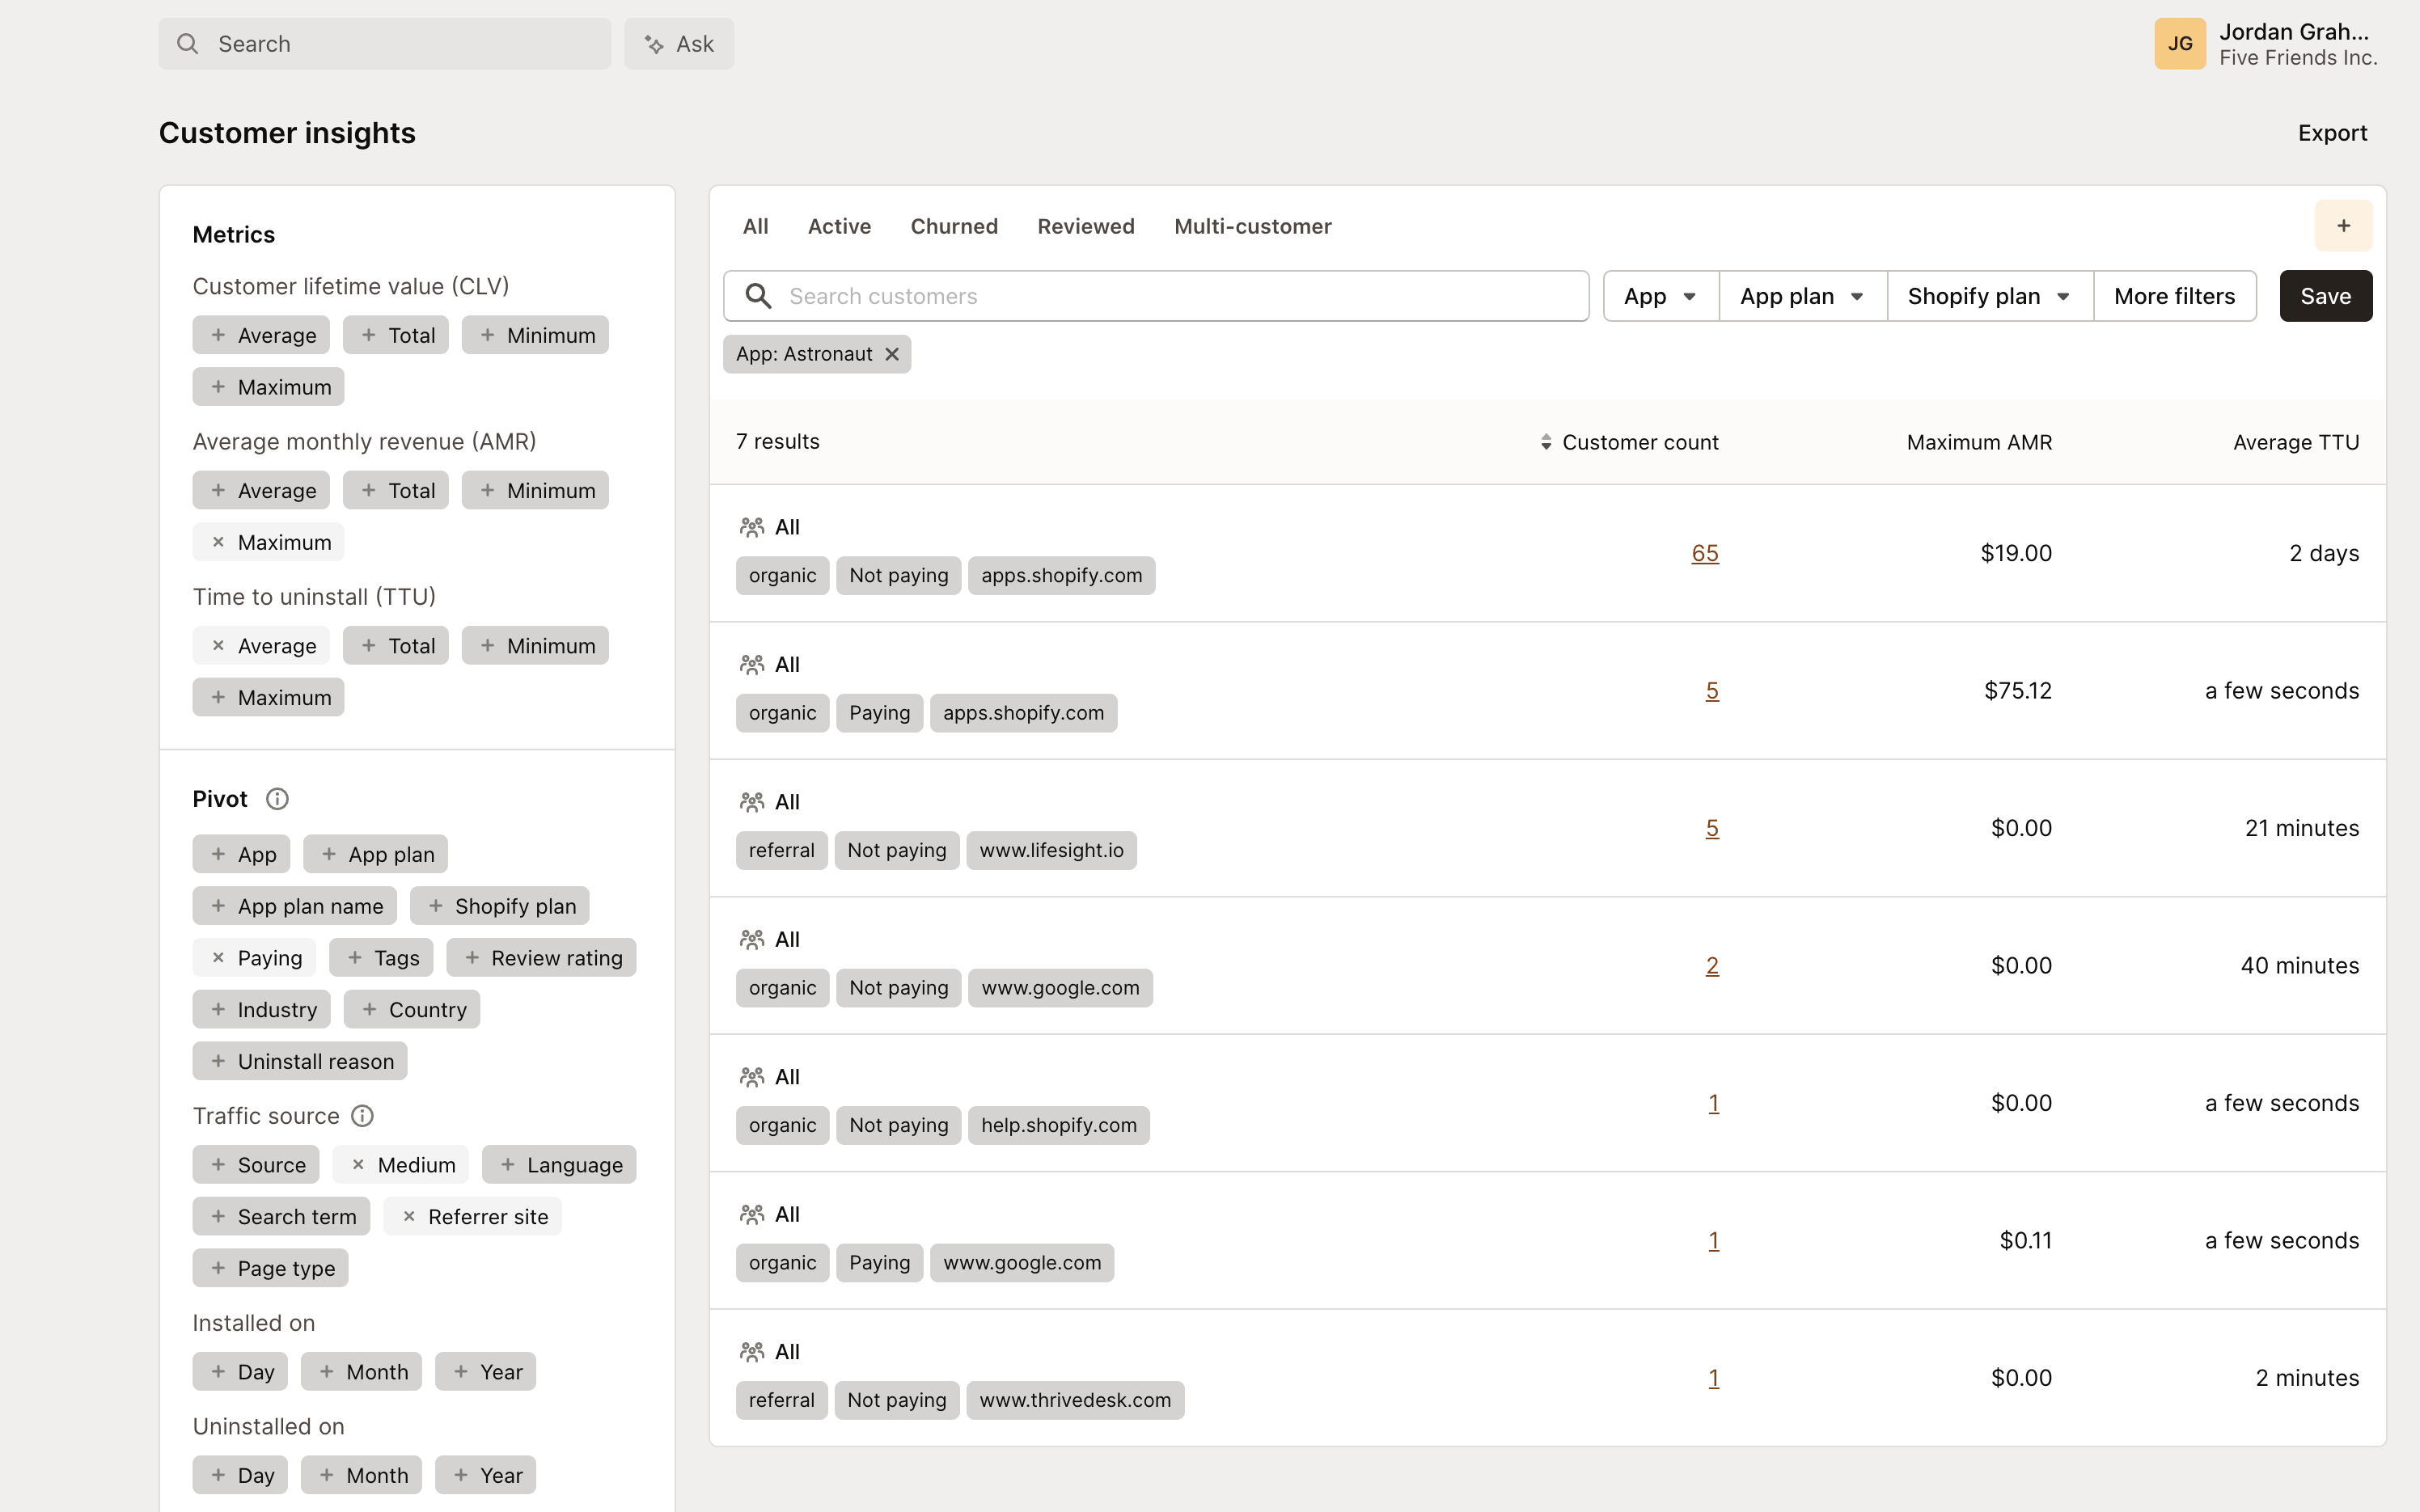
The Customer Insights dashboard organizes your data for immediate analysis:
- From the Customers screen, click Insights in the left navigation
- Select the metrics you want to analyze from the left panel
- Apply filters to focus on specific customer segments
- The data table and measurements update in real-time as you refine your view
Key metrics & analysis
Mantle tracks several critical metrics that help you understand customer value and behavior:
Customer lifetime value (CLV)
Understand how much revenue your average customer generates over their entire relationship with your business:
- Click the + buttons next to CLV to add calculation methods:
- Average: The mean value across all customers in this segment
- Total: The combined lifetime value of all customers shown
- Minimum/Maximum: The range of values to identify outliers and opportunities
Average monthly revenue (AMR)
Track your recurring revenue patterns to forecast and plan effectively:
- Add multiple calculation methods to gain different perspectives:
- Average: Typical monthly spend per customer
- Total: Combined monthly revenue from all customers in the segment
- Minimum/Maximum: The spending range across your customer base
Time to uninstall (TTU)
Measure how long customers typically use your app before churning:
- Add different calculation methods to understand retention patterns:
- Average: How long a typical customer stays before uninstalling
- Total: Cumulative time all customers spent with your app
- Minimum/Maximum: Identify your best and worst retention cases
Filtering & segmentation
Narrow your analysis to specific customer groups to uncover actionable insights:
Segment analysis
Customer Insights works seamlessly with segments you create in the customer view:
- Create and save custom segments in the Customers section based on any combination of filters
- Navigate to Customer Insights to analyze these segments in depth
- Select your saved segment from the dropdown to instantly view metrics for that specific customer group
- Compare performance across different segments to identify patterns and opportunities
This powerful connection between segmentation and analysis lets you answer targeted business questions like:
- Which customer segments have the highest lifetime value?
- How does retention differ between customers acquired from different sources?
- What patterns emerge when comparing high-engagement vs. low-engagement customers?
Applied filters
Refine your view with precise filtering:
- Click the search bar to find customers by name, email, or domain
- Use dropdown selectors to filter by app plan, Shopify plan, and more
- Click More filters to access the full range of filtering options
- Your applied filters appear as tags that you can easily remove or modify
The Customer Insights table immediately updates to show:
- The number of customers matching your criteria
- Key metrics for the filtered segment
- Individual customers and their specific values
Pivot analysis
Break down your metrics by different dimensions by adding pivot filters from the left panel:
- Under the Pivot section, click + next to the dimension you want to analyze
- Common pivots include App plan, Paying status, Country, and Traffic source
- Your results will group customers by these dimensions, showing metrics for each group
- Compare values across groups to identify patterns and opportunities
Valuable pivot dimensions include:
- App plan: See how different subscription tiers perform
- Payment status: Compare metrics between paying and non-paying customers
- Traffic source: Identify which acquisition channels bring your most valuable customers
- Geography: Discover regional patterns in value and retention
- Industry: Learn which business types generate the most revenue
Best practices
Get the most value from Customer Insights with these practical tips:
- Combine metrics strategically: Look at CLV alongside TTU to understand the relationship between retention and revenue
- Compare across dimensions: Use pivots to find unexpected patterns, like which traffic sources bring your highest-value customers
- Look for outliers: Identify unusual values that might indicate problems or opportunities
- Track trends over time: Export data regularly to build a historical view of your performance
- Test hypotheses: Use insights to form theories, then validate with targeted segments
- Share findings regularly: Make data-driven decisions by incorporating insights into your regular business reviews
Actionable insight examples
Here are specific ways to turn Customer Insights into business results:
Revenue opportunities
- Compare CLV across different app plans to identify underpriced or overpriced tiers
- Filter for customers with high usage but low-tier plans to find upgrade candidates
- Identify paying vs. non-paying segments to discover conversion opportunities
Retention improvements
- Compare TTU across different onboarding experiences to optimize first impressions
- Find combinations of features that correlate with longer retention
- Identify customer segments with unusually short TTU for targeted intervention
Acquisition optimization
- Compare CLV across traffic sources to prioritize your most profitable marketing channels
- Analyze which customer segments have the highest AMR to refine your ideal customer profile
- Identify geographic or industry segments with strong metrics to focus expansion efforts
Product development
- Correlate feature usage with CLV to prioritize your development roadmap
- Find patterns in customer segments that generate the highest revenue
- Identify which aspects of your app correlate most strongly with long-term retention
By regularly analyzing your Customer Insights, you’ll develop an increasingly nuanced understanding of what drives value in your business - and exactly which levers to pull for growth.