Mastering your Traffic Sources: Double Down on What Drives Growth
Your app listing gets discovered across a range of surfaces from search results and category pages to Shopify & Google Ads, and affiliate links. But not all traffic is created equal. Some sources drive vanity metrics like views, while others actually lead to installs and revenue.
That’s why it’s critical to move beyond siloed reporting and start looking at your traffic sources through a unified lens where you can compare and contrast different growth levers side-by-side.
For a complete overview of traffic sources features and available data, check out our Traffic Sources documentation.
Now that your report is set up, let’s walk through how to interpret it and take action.
Where is Your Best Traffic Actually Coming From?
Step 1: Get the lay of the land
The first step in optimizing your app’s performance is understanding where your traffic is actually coming from. You need to identify which sources are driving app listing views and installs. This foundational knowledge helps you answer critical questions about which channels should receive the largest portion of your marketing budget.
Key Actions:
- Pivot your data by source to see numbers across each traffic channel
- Answer questions like “How many listing views are coming from ChatGPT?”
- Drill down further in the funnel to see “How many listing views from ChatGPT are converting to app installations?”
Step 2: Break it down further.
Once you have understanding of the source, you should break it down further. Dig into each source further by examining how much traffic comes from different mediums and campaigns.
Example: Analyzing Organic v/s Paid Traffic from Shopify
- Filter by source: Set source = “app.shopify.com”
- Pivot by medium: Break down into:
- Organic (medium = “organic”): Users who found you through Shopify’s search results, browsing categories, or recommendations
- Paid (medium = “cpc”): Users who clicked on your Shopify ads
- Compare the data:
- Organic: 873 views, 99 installs, 59 subscriptions, $147/220 MRR
- Paid: 542 views, 97 installs, 68 subscriptions, $220/220 MRR
- Key insights:
- Paid traffic converts better
- Organic drives more volume but paid drives higher quality sign-ups
- Formulate into Next Steps: Consider increasing Shopify ad budget while improving organic listing optimisation to get better quality subscribers.
Example: Analysing Different Ad Campaign
- Filter by source: Set source = “adwords”
- Pivot by medium: Set the medium as “cpc”
- Pivot by campaign: Break down into specific campaign names.
- Brand Campaign: “Brand - Exact Match Keywords” (people searching for your app name)
- Competitor Campaign: “Competitor - Alternative Keywords” (people searching for competitor apps)
- Compare campaign performance:
- Brand Campaign: 800 views, 48 installs, 18 subscriptions (2.25% subscription rate)
- Competitor Campaign: 1,500 views, 35 installs, 9 subscriptions (0.6% subscription rate)
- Key insights:
- Brand searches convert incredibly well but have lower visibility
- Competitor campaigns drive decent volume but the conversion rate is poor
- Next Steps: Increase budget for brand awareness by investing in social presence, and optimize competitor ad copy to demonstrate more value compared to competitors and drive better conversion.
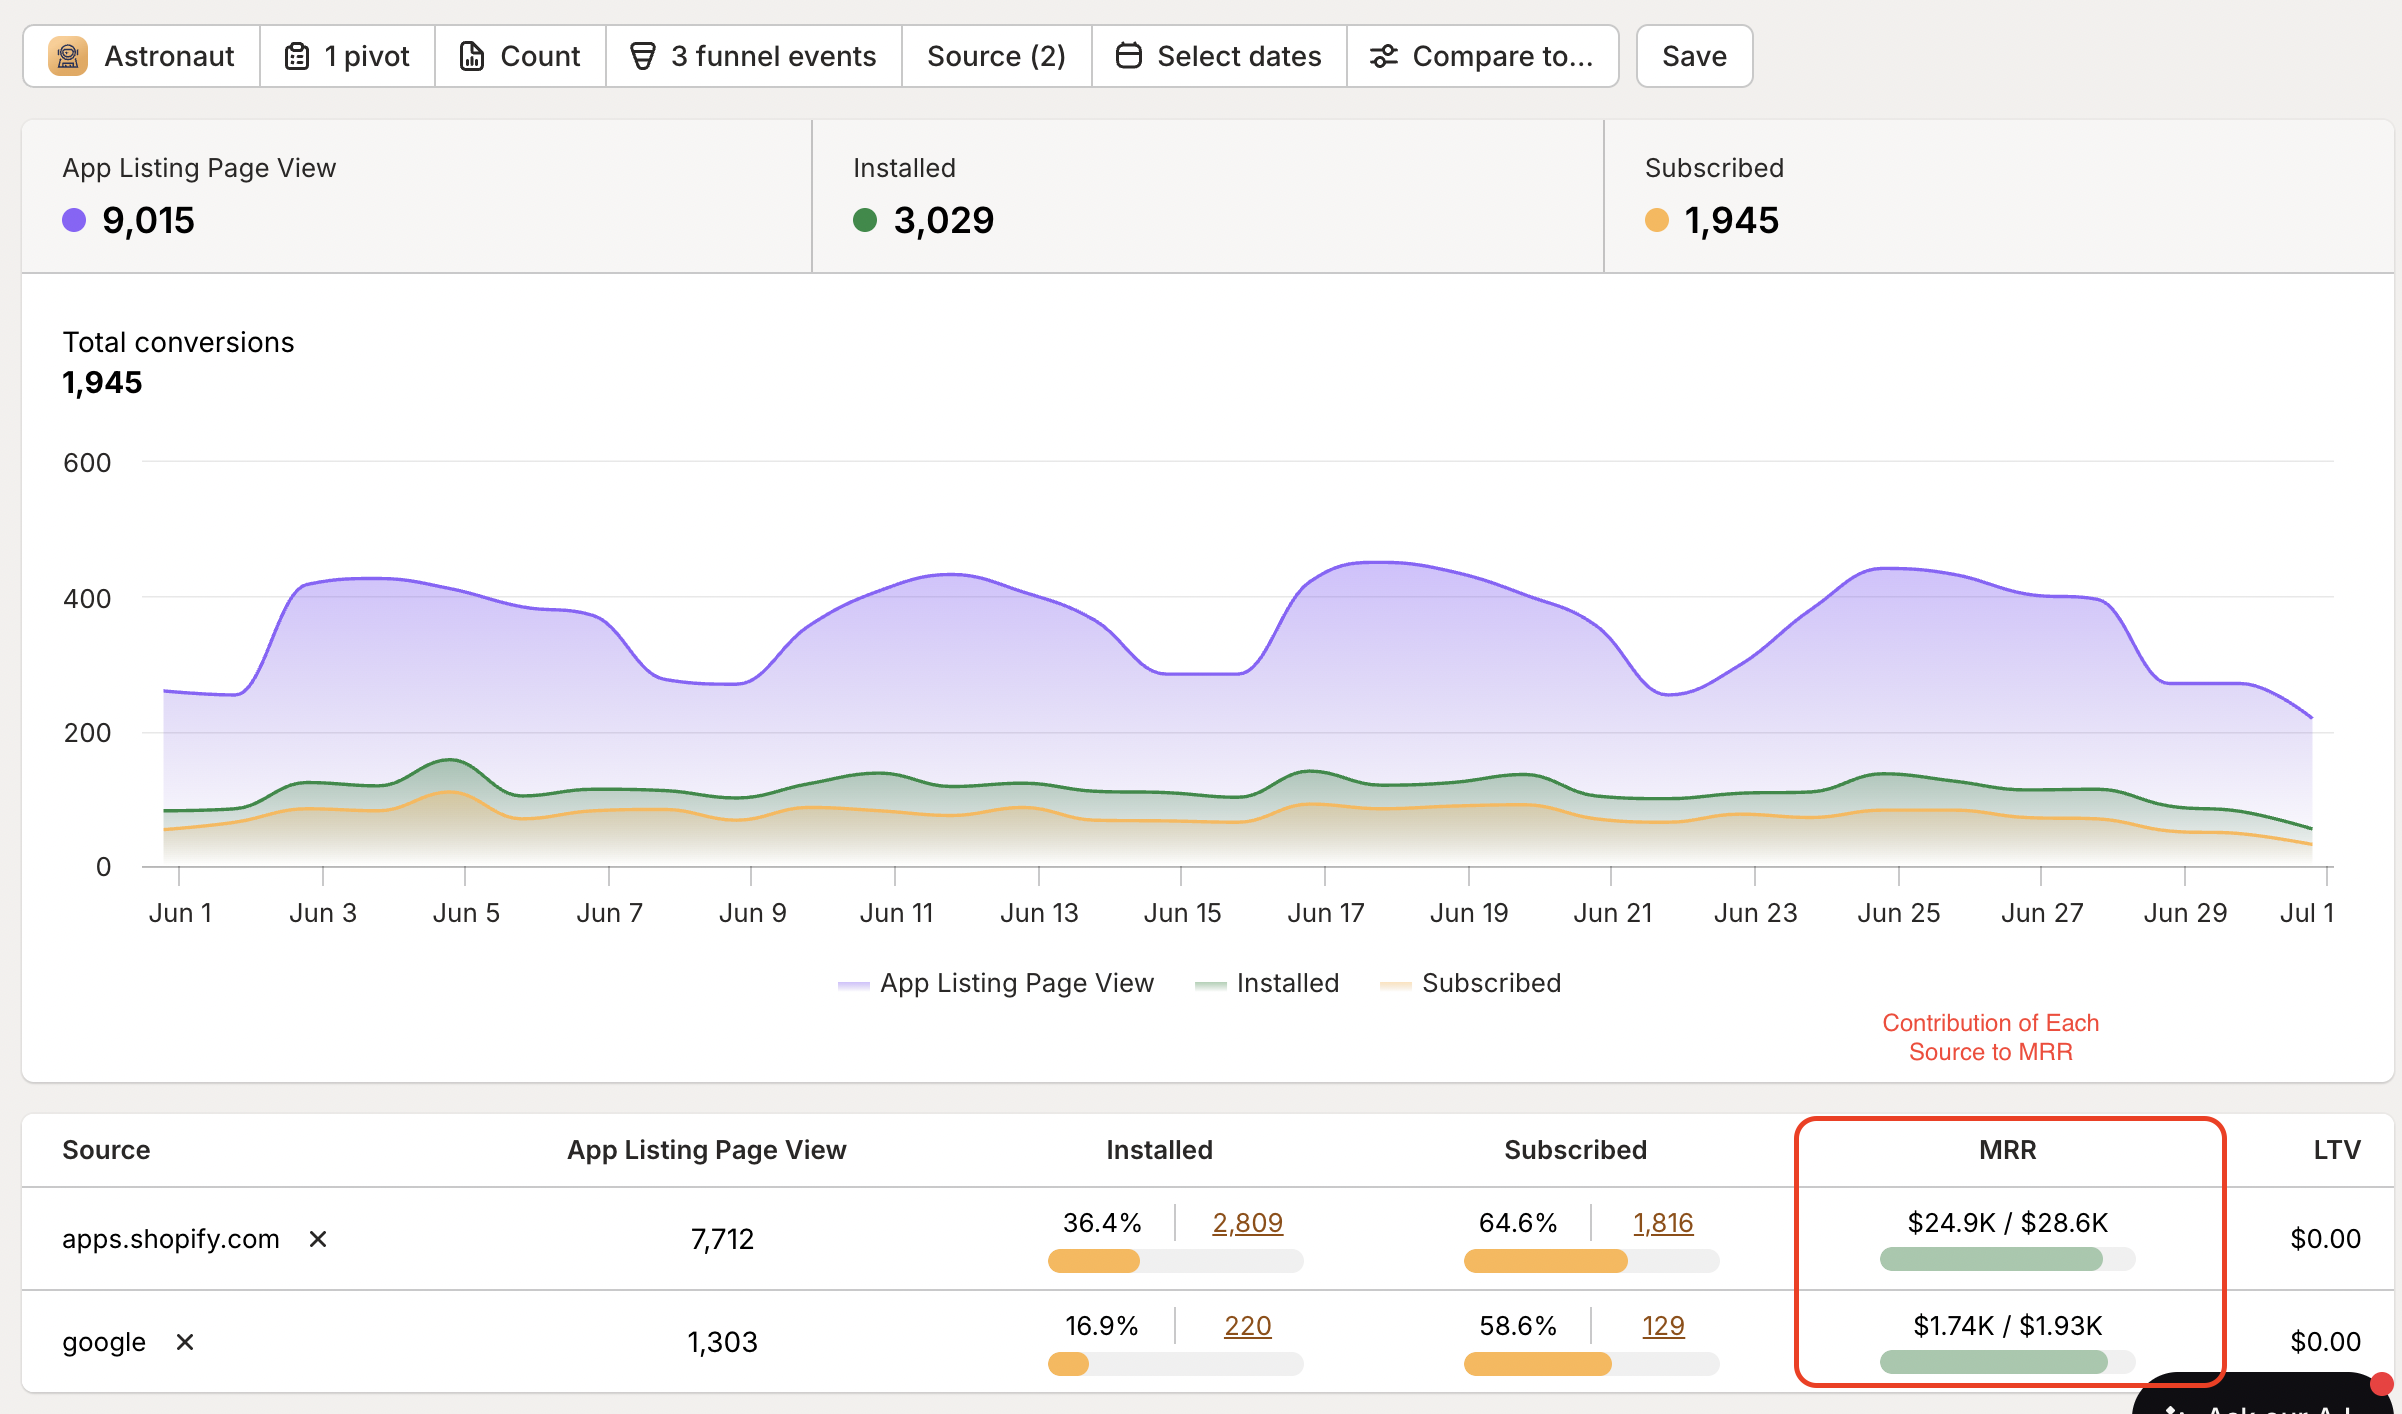
Moving beyond vanity metrics: track what drives revenue
There are so many sources and mediums you can optimize for but you want to double down on sources which move the business needle. So you will focus on sources which drive a higher MRR number. not just converting from listing views to installations but using the funnel event “subscribed” - you can see how many are converting to a paid subscription so you can double down on that channel.
Key mindset shift:
- Stop optimizing for views or even installs alone
- Start optimizing for Monthly Recurring Revenue (MRR)
How to do it:
- Use the MRR chart in your Traffic Sources Report
- Track conversions from listing views → installations → paid subscriptions
- Remember: 1,000 views with 2 paid subscriptions which contribute 10K to MRR beats 5,000 views with 0 subscriptions every time.
Optimizing affiliate relationships
If you’re investing heavily in affiliate marketing through content creation, it’s easy to get caught up in vanity metrics. A lot of followers doesn’t automatically translate to meaningful business results. Let’s say you’ve partnered with several e-commerce influencers who are creating long-form YouTube videos featuring your app. Each influencer has their own referral link, and while their follower counts might look impressive, the real question is: which ones are actually driving results?
Action plan:
- Pivot your “source” by affiliate on the Traffic Sources Attribution Report.
- Track each partner’s performance on two key metrics:
- App Listing Views generated
- Paid subscriptions converted
- Compare performance across all affiliates
What to look for:
- Which affiliate converts views into paid subscribers?
- Which content types resonate most with your target audience? (By the virtue of affiliate driving most subscriptions).
Optimize ad spend with lifetime value analysis
Lifetime Value (LTV): LTV is the total revenue you expect to generate from a customer over their entire relationship with your app. It’s a predictive metric that helps you understand not just what a customer pays today, but what they’re worth over months or years.
How to analyse LTV by traffic source:
Step 1: Filter your data by source and medium
- Source: “app.shopify.com” + Medium: “cpc” (Shopify Ads traffic)
- Source: “google.com” + Medium: “cpc” (Google Ads traffic)
Step 2: Glance at the LTV for each of the paid channels
Example analysis:
- Shopify Ads customers: LTV = $x
- Google Ads Customers: LTV = $y
Step 3: Compare LTV to your Customer Acquisition Cost (CAC)
Budget Allocation Strategy:
Example of Shopify App:
Let LTV from Google Ads: $240
Let LTV from Shopify Ads: $195
Current Shopify CAC: $30
Current Google Ads CAC: $60
- Google Ads: LTV $240 / current CAC $60 → Ratio 4:1 (healthy, can increase spend)
- Shopify Ads: LTV $195 / current CAC $30 → Ratio 6.5:1 (goldmine, double down here)
Key insights this reveals:
- Shopify traffic not only converts well but stays longer (higher retention)
- Google traffic looks promising but needs more experimentation
Follow the 70/20/10 Framework
- 70% from your best-performing, proven channels
- 20% from promising channels you’re scaling
- 10% for bold, crazy and innovative ideas
Applying the Framework in our Example
Spend 70% on Shopify Ads, 20% on Google Ads and 10% on maybe youtube ads.
Master the exact terms that make people install and pay
One of the most valuable insights comes from pivoting your data by “search term.” This reveals the exact words and phrases your prospects use when they find your app, and more importantly, which ones lead to conversions.
How to Analyse search terms:
Step 1: Add “search term” as the pivot to your “traffic sources attribution report”
Step 2: Sort by conversion metrics
Step 3: Look for patterns in high-converting terms
Example analysis:
- “a/b testing” → 222 views, 27 installs, 15 subscriptions (55.56% conversion)
- “ab test” → 139 views, 20 installs, 13 subscriptions (65% conversion)
Key insights from this data:
- Best Search Term: “ab test” is your conversion goldmine—people searching for this are ready to buy and have a higher LTV.
Brand vs. generic analysis:
Break down your search terms into two categories:
- Brand-based searches: People looking specifically for your app name or that of your competitors
- Generic solution searches: People looking for the problem your app solves
Quick Tips
- Look for long-tail search terms from the list which convert well as these are cheaper to run ads on.
- Misspelled words: A Bundle Builder App found the keyword “bundel” driving good traffic, and made this a part of their marketing strategy.
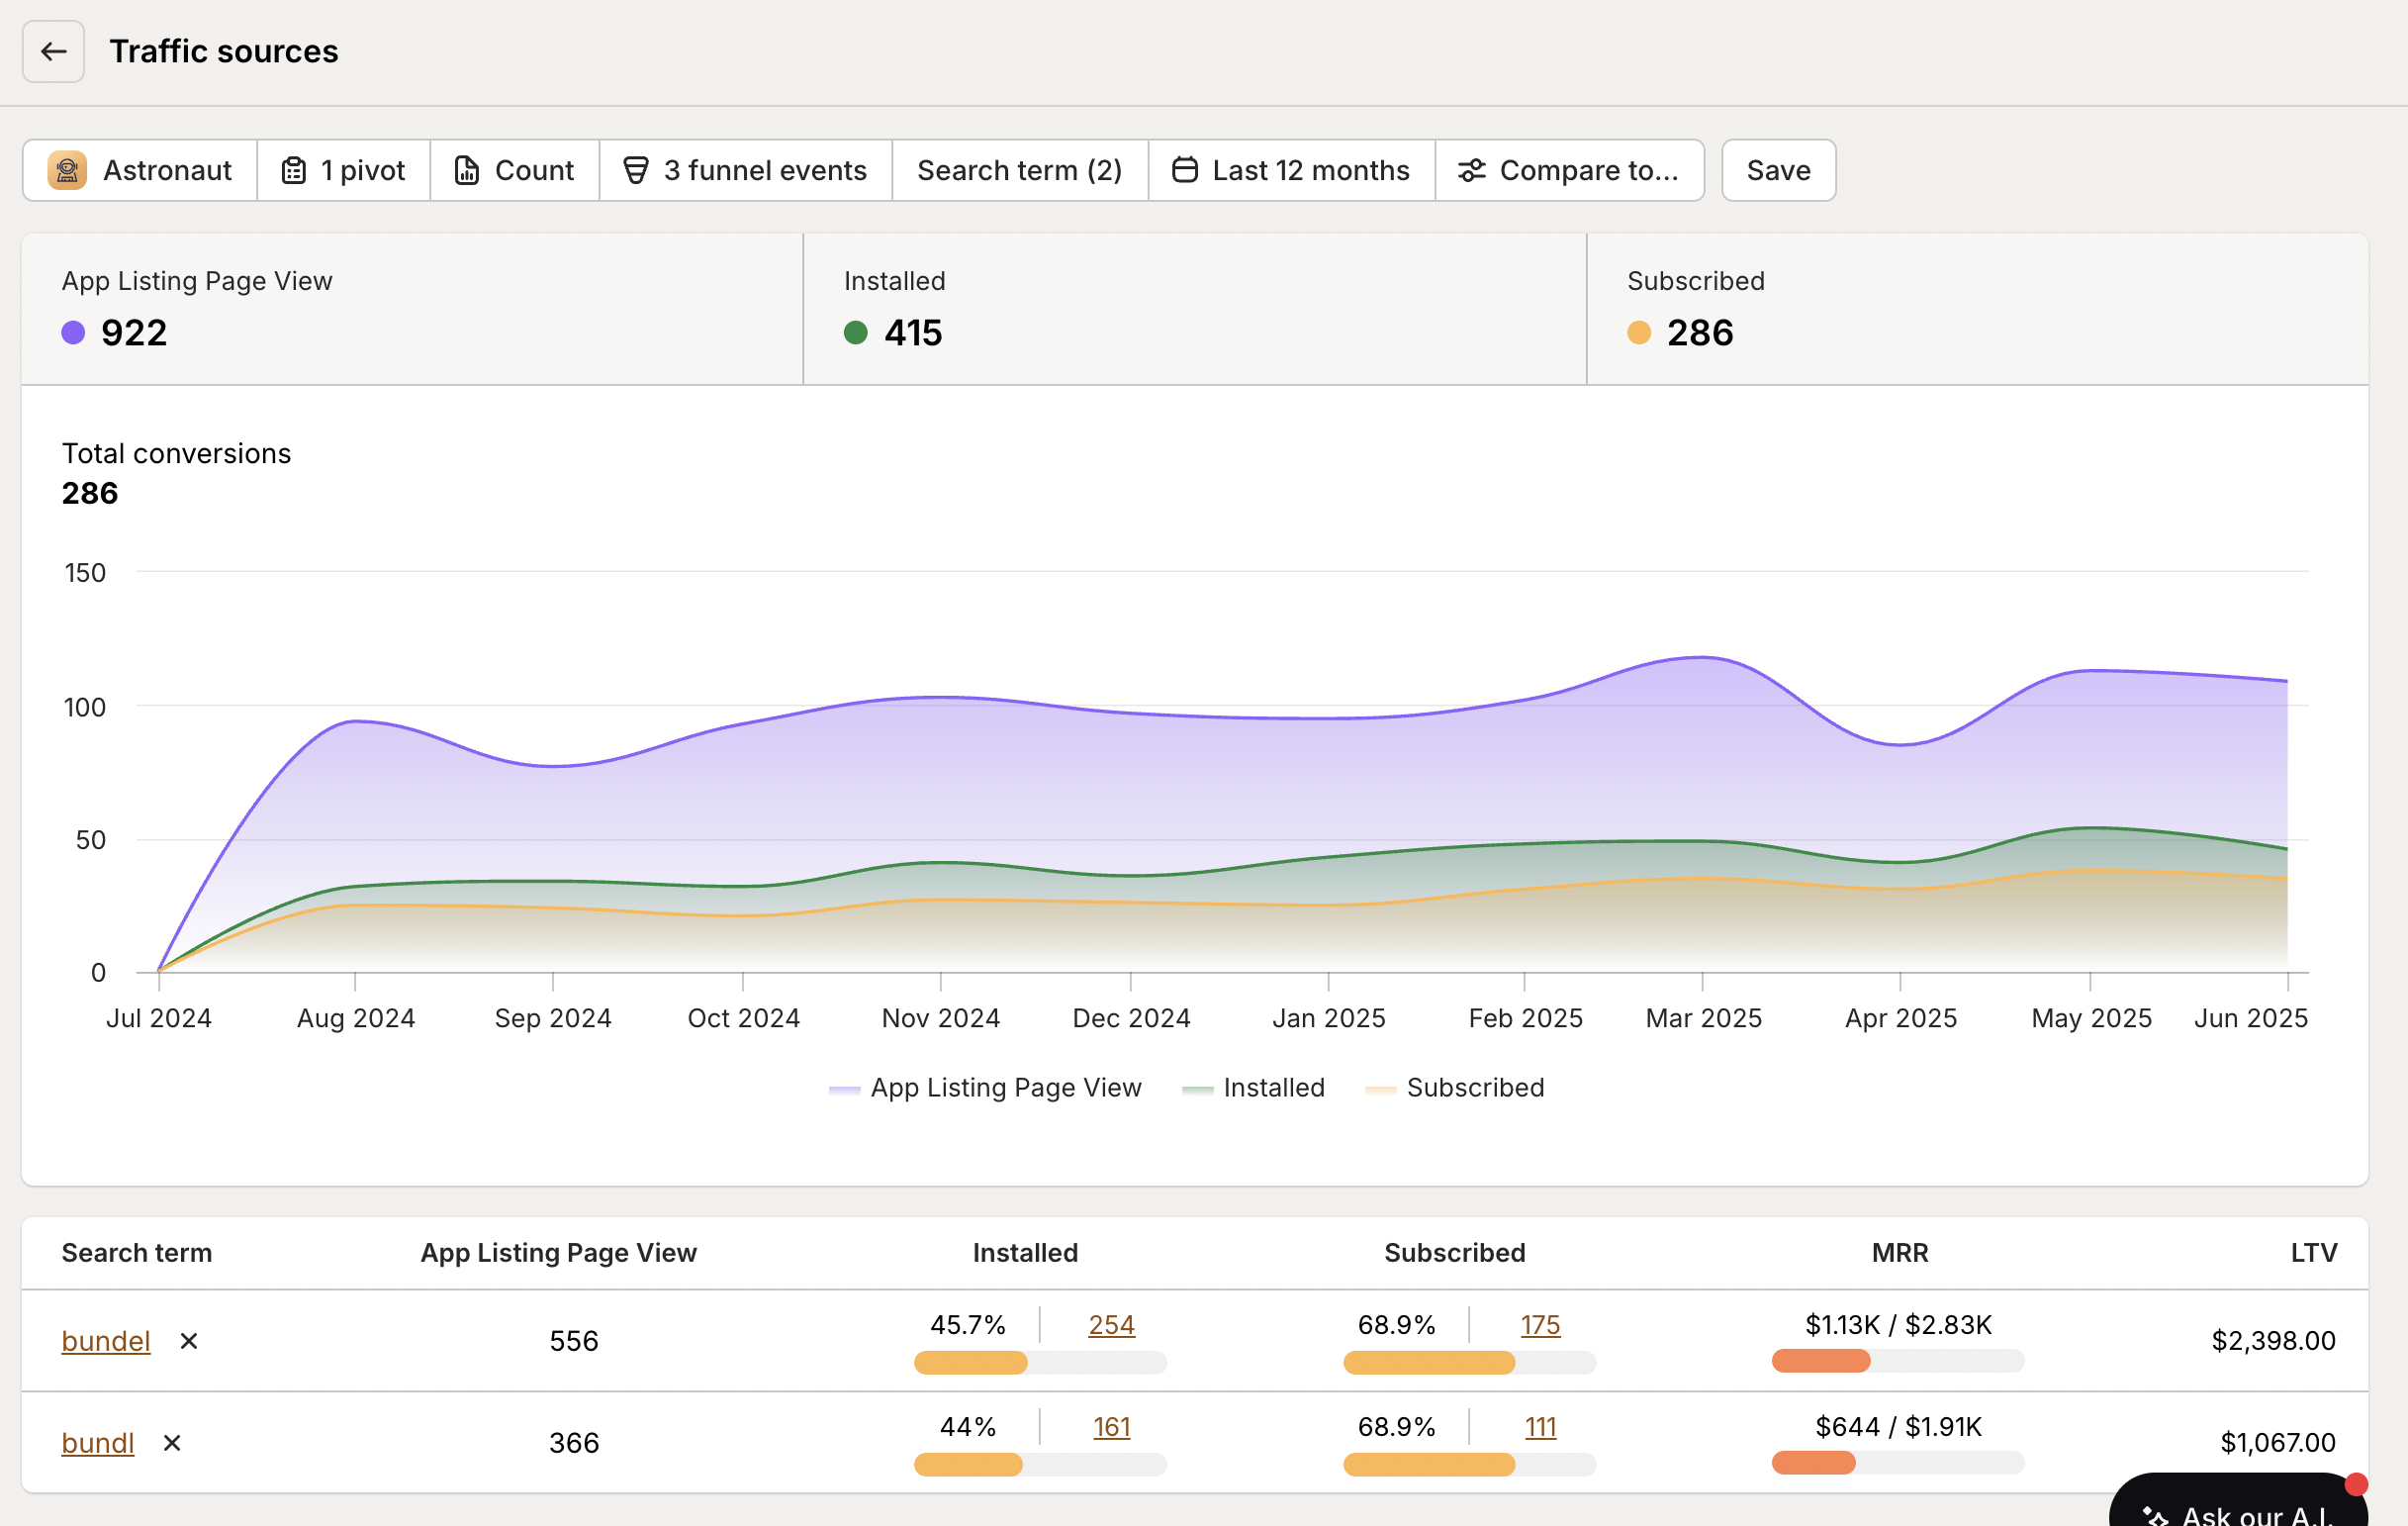
- Unexpected phrases: Sometimes prospects use terminology you never considered
Track your optimisation impact
Don’t just make changes and hope for the best. Compare performance across multiple time periods to see if your optimisations are yielding real results.
How to do it:
- Set up time period comparisons (e.g., Previous 30 days)
- Focus on the same metrics: installation count and conversion to paid subscribers
- Look for statistically significant changes, not just small fluctuations
Example scenario: You’re running a Shopify ad campaigns and decide to increase the budget on your campaign by 50%.
Time period comparison:
- Previous 90 days: 673 views, 83 installs, 59 subscribers
- Current 90 days: 1960 views, 288 installs, 177 subscribers
Key insights:
- 50% budget increase led to 291% more views (good targeting consistency)
- Install rate improved from 12.3% to 14.7% (campaign is scaling well)
- Subscription rate dropped from 71.1% to 61.5% (drop in conversion to paid plan)
Conclusion:
The optimisation efforts are successfully driving increased views and installs, effectively expanding top-of-funnel metrics. However, conversion rates to paid subscriptions remain low.
Analysis of the funnel report in collaboration with onboarding and customer experience teams would help identify specific drop-off points in the user journey from app installation through to subscription conversion. Understanding where users abandon the process would enable targeted efforts to improve conversion rates.
Some questions to consider:
- At what point during onboarding are most users dropping off?
- Was there an economic downturn (such as imposing tariffs) which led to poor conversion rate?
- What did the set-up process look like the current 90 day scenario v/s previous 90 days?
How to report like a pro
Use this weekly reporting template to clearly show what’s working, what’s not, and what’s next. It’s built to make your marketing impact stand out.
- Top Performing Source:
- Total Organic Installs:
- Total Paid Ad Installs:
- Top Category Ranks (SASI):
- Top 3 Keywords Driving Traffic:
- Highest LTV Source and Value:
- Average LTV:
- Conversion Rate: App Store Views → Installs (%):
- Conversion Rate: Installs → Subscriptions (%):
- Week-over-Week Conversion Trend for Top Source:
- Marketing Plans for This Week:
Make this your go-to format every Friday. When the founder asks what’s working, this could be your answer ;)
Final thoughts
Your app listing is a growth engine. When you understand which channels are actually driving installs, revenue, and long-term customers, you can make smarter decisions and scale with confidence.
So go beyond the vanity metrics, double down on what’s working, and use this report not just to track performance, but to tell the story of your marketing impact.